Data taken into consideration is :
- score changes and related events (trys, converted trys, goals, drop-goals).
- missed goals
- yellow cards
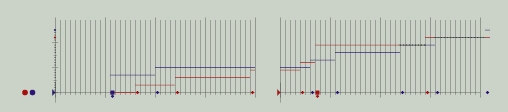
Three alternative visualisations (SVG) offer a synthetic view over densities and types of events all along the match as in these examples:
ScoreLine viz:
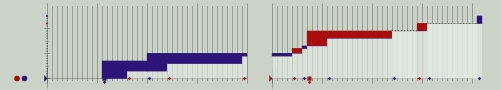
ScoreChart viz:
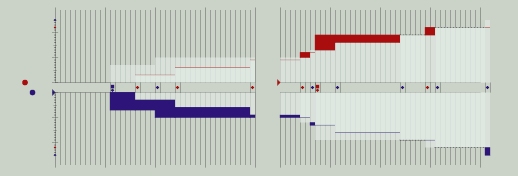
ScoreMap viz:
scoreline viz are SVG files, produced on-the-fly. Make sure SVG files can be read on your computer.
All you need to do then is to fill in the following form. However please read carefully the instructions (formatting in particular),
as this online implementation is an experimental platform (no formatting error will be detected).
download the SVG file